上学期的时候水了一篇图像压缩与线性代数,是线性代数小组合作探究的一个小部分,然后这学期的选了个数字图像处理。本来以为是个水课,结果听了两节之后发现对于数学不好的我过于硬核,后面的课基本都在划水了。临近期末突然布置了课设,没办法,还是得从头看起。
本来这课是用得Matlab,但问了下老师,用Python可以(也可以用C++, 可我不会啊),所以我是用Python完成的。这里把我的答案记录下来。(据说题目是祖传的,可以造福后辈x)
第一题
将图像的灰度级分辨率调整至{128,64,32,16,8,4,2} ,并在同一个figure窗口上将它们显示出来。
第一题还是挺简单的,就做一下整除就可以了。
import numpy as np
import matplotlib.pyplot as plt

plt.figure(figsize=[8,16],dpi=50)

img_256 = plt.imread('../img/lena.bmp')
# 读取图片

img_128 = np.int8(img_256 / 2)
img_64  = np.int8(img_256 / 4)
img_32  = np.int8(img_256 / 8)
img_16  = np.int8(img_256 / 16)
img_8   = np.int8(img_256 / 32)
img_4   = np.int8(img_256 / 64)
img_2   = np.int8(img_256 / 128)
# 调整色阶至{128,64,32,16,8,4,2}

plt.subplot(4,2,1)
# 选择子图
plt.title('Origin')
# 设置标题
plt.imshow(img_256,cmap='gray',vmin=0,vmax=255)
# 打印图片
# 参数: 图片源,打印的色集(这里全部选择gray),最小色阶,最大色阶

plt.subplot(4,2,2)
plt.title('128')
plt.imshow(img_128,cmap='gray',vmin=0,vmax=127)

plt.subplot(4,2,3)
plt.title('64')
plt.imshow(img_64,cmap='gray',vmin=0,vmax=63)

plt.subplot(4,2,4)
plt.title('32')
plt.imshow(img_32,cmap='gray',vmin=0,vmax=31)

plt.subplot(4,2,5)
plt.title('16')
plt.imshow(img_16,cmap='gray',vmin=0,vmax=15)

plt.subplot(4,2,6)
plt.title('8')
plt.imshow(img_8,cmap='gray',vmin=0,vmax=7)

plt.subplot(4,2,7)
plt.title('4')
plt.imshow(img_4,cmap='gray',vmin=0,vmax=3)

plt.subplot(4,2,8)
plt.title('2')
plt.imshow(img_2,cmap='gray')

plt.savefig('./output.png',dpi='figure',format='png')
plt.show()
plt.close()
最终的结果

第二题
往图像中叠加不同类型的噪声,并设计一个频域低通滤波器来去除之
如何生成噪声
首先来看一下如何生成随机噪声,scipy.image 提供了这个函数
import matplotlib.pyplot as plt
import numpy as np
import skimage
import skimage.io
import skimage.util

img = skimage.io.imread('../img/bank.bmp')
noise_type = ['gaussian','localvar','poisson','salt','pepper','s&p','speckle']
# 噪声的类型

plt.figure(figsize=[8,16],dpi=150)
gimg = {}

for index,mode in enumerate(noise_type):
    plt.subplot(4,2,index+2)
    gimg[mode] = skimage.util.random_noise(img,mode=mode)
    plt.title(mode)
    plt.imshow(gimg[mode],cmap='gray')

plt.subplot(4,2,1)
plt.title('Origin')
plt.imshow(img,cmap='gray',vmin=0,vmax=255)


plt.savefig('generate.png',dpi='figure',format='png')
plt.show()
plt.close()
生成的噪声图片

低通滤波器
低通滤波器分三种,区别在传递函数的不同
理想低通滤波器(ILPF)
$$ H(x) = \begin{cases} 1 \quad D(u,v) \leq D_0 \\ 0 \quad D(u,v) \gt D_0 \end{cases} $$
def ilpf(img,n0):
    G = np.fft.fft2(img)
    FG = np.fft.fftshift(G)
    # 进行傅里叶变换
    x = FG.shape[0]
    y = FG.shape[1]
    H = np.ones((x,y))
    for i in range(1,x):
        for j in range(1,y):
            r1 = (i - x/2)**2 + (j - y/2)**2
            r = np.sqrt(r1)
            if r > n0:
                H[i,j] = 0
    con = FG * H
    # 与传递函数相乘
    return abs(np.fft.ifft2(con))
    # 反傅里叶变换

plt.figure(dpi=150, figsize=[18,24])

for index,mode in enumerate(noise_type):
    plt.subplot(7,5,index*5 +1)
    plt.title(mode)
    plt.imshow(gimg[mode],cmap='gray')
    for i in range(1,5):
        plt.subplot(7,5,index*5+i+1)
        plt.title(f'n0 = {i*20}')
        plt.imshow(ilpf(gimg[mode],i*20),cmap='gray')
plt.savefig('ilpf.png',dpi='figure',format='png')
plt.show()
plt.close()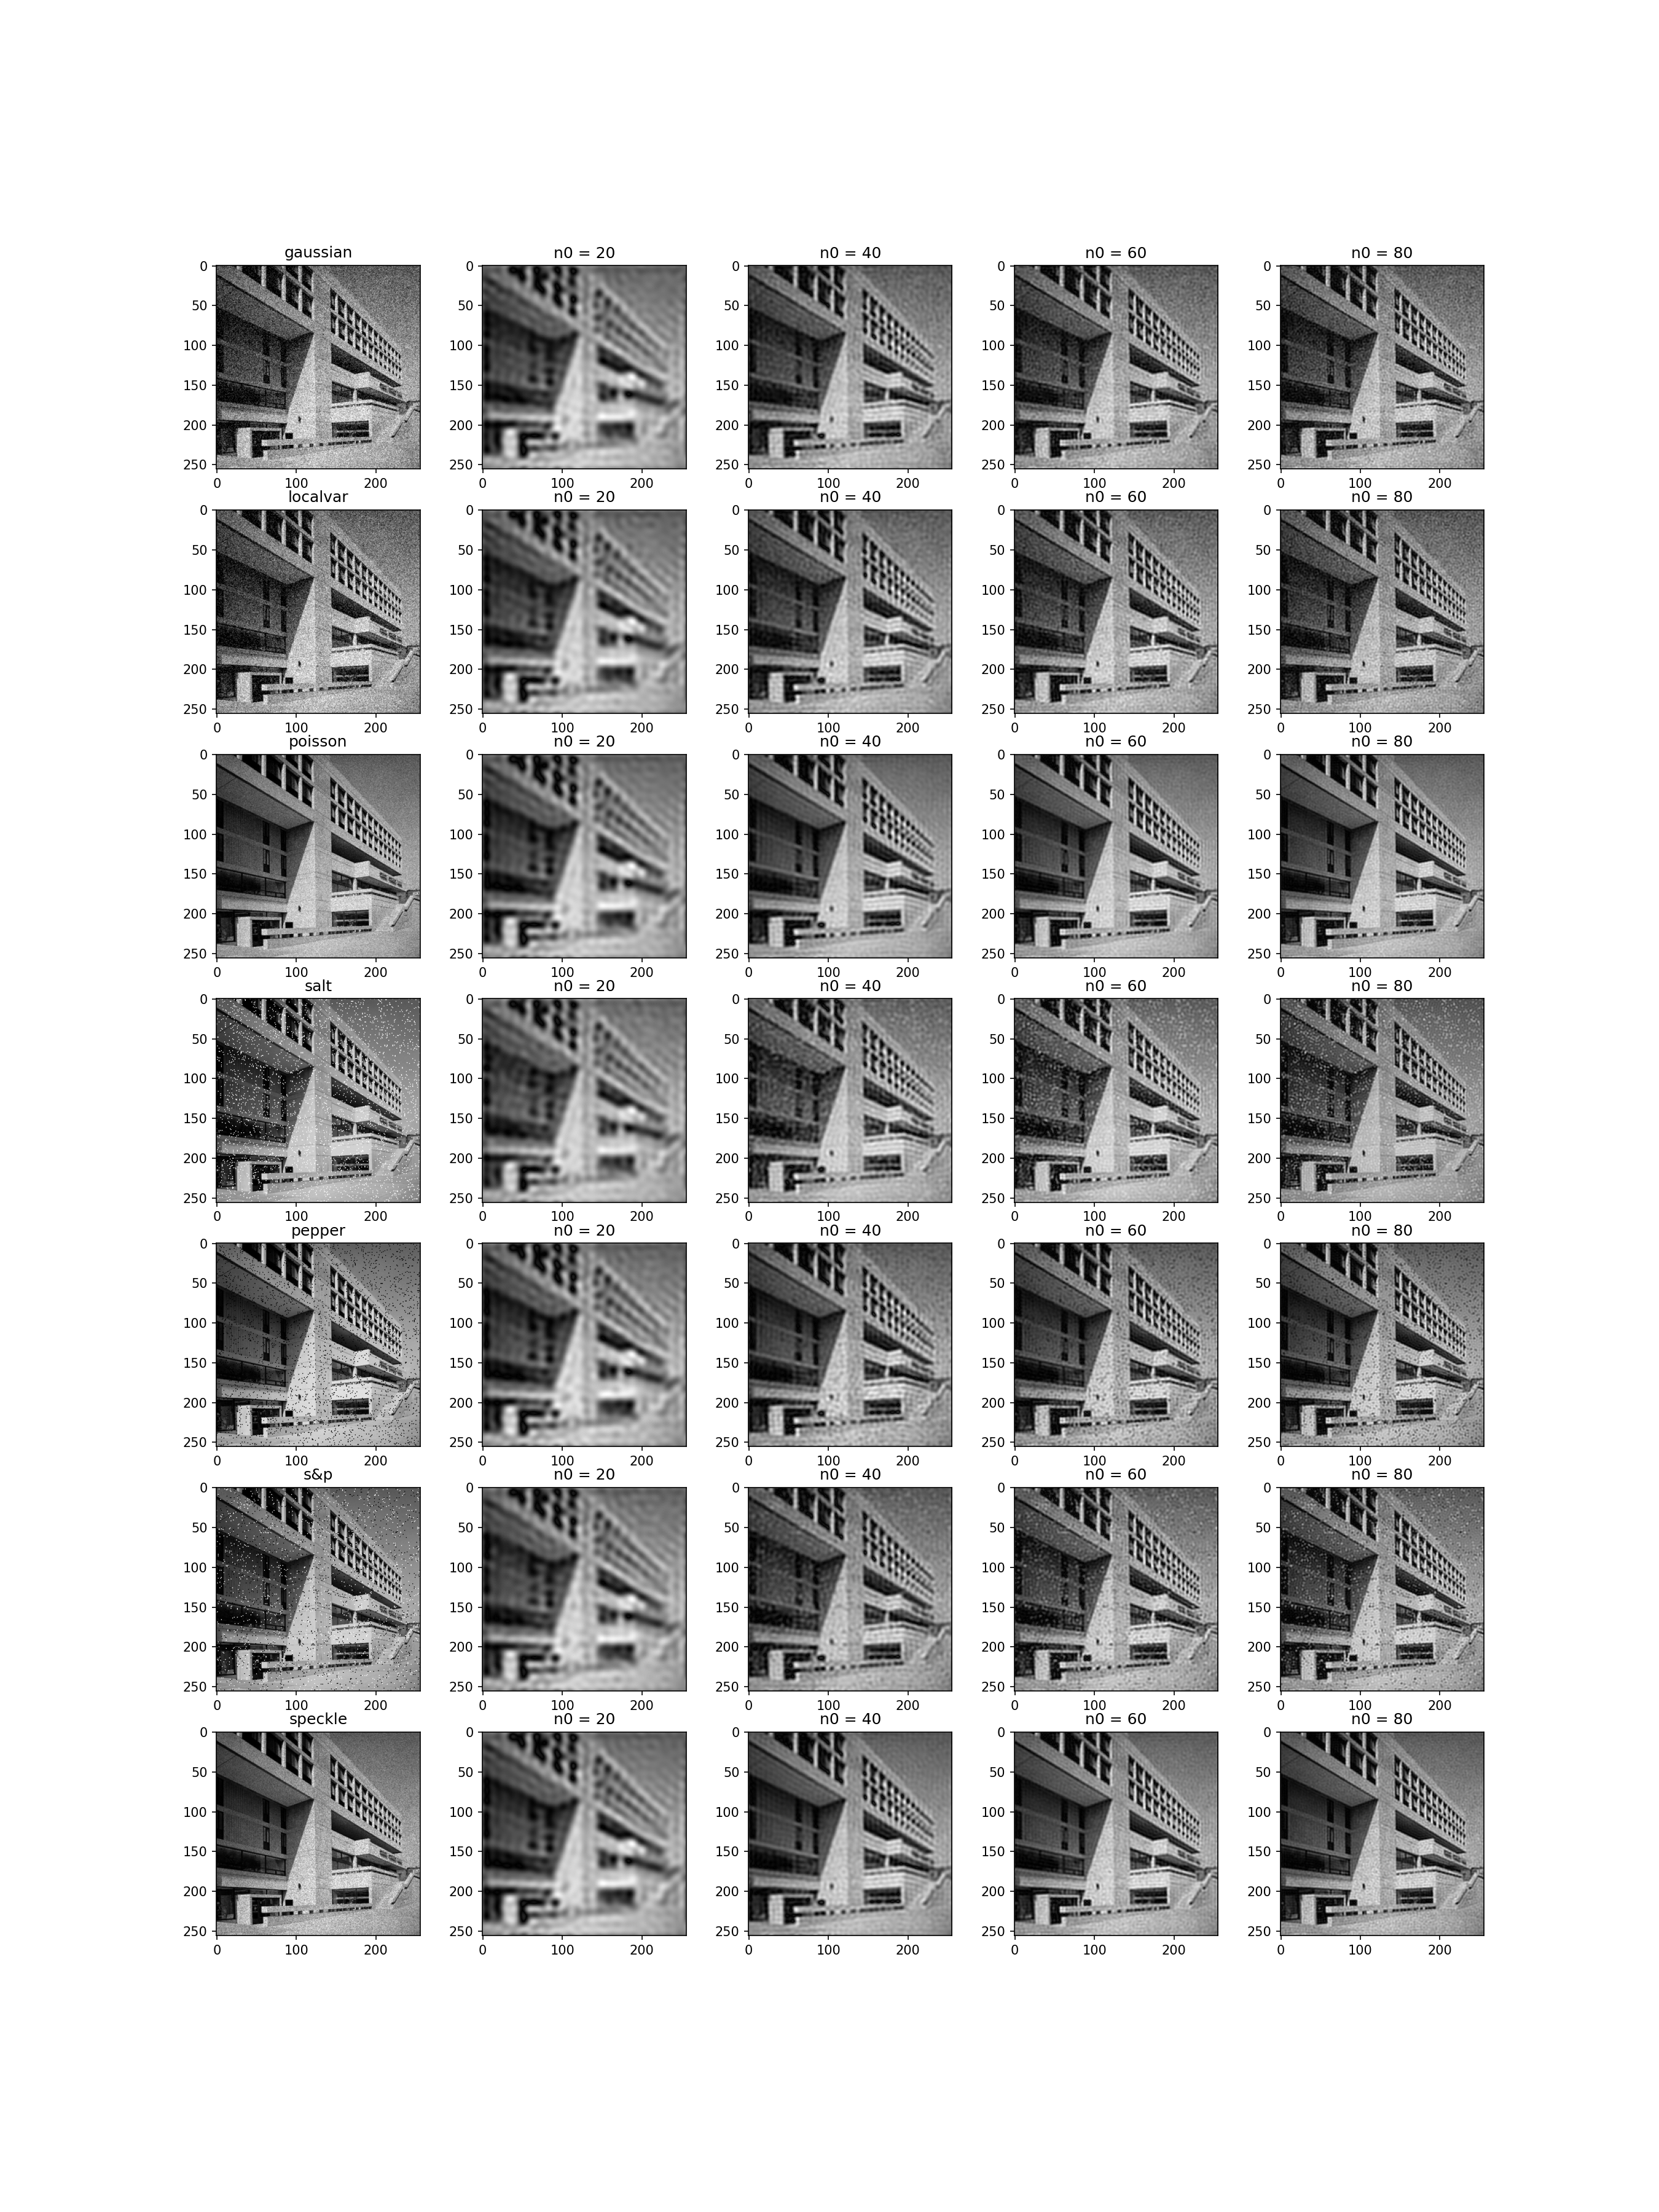
Butterworth 低通滤波器 (BLPF)
$$ H(x) = \frac{1} {1 + [\frac{D(u,v)}{D_0}]^{2n}} $$
def blpf(img,n0):
    G = np.fft.fft2(img)
    FG = np.fft.fftshift(G)
    x = FG.shape[0]
    y = FG.shape[1]
    H = np.ones((x,y))
    for i in range(1,x):
        for j in range(1,y):
            r = np.sqrt((i-x/2)**2 + (j-y/2)**2)
            if r > n0:
                H[i,j] = 1/(1 + (r/n0)**3)
    con = FG * H
    return abs(np.fft.ifft2(con))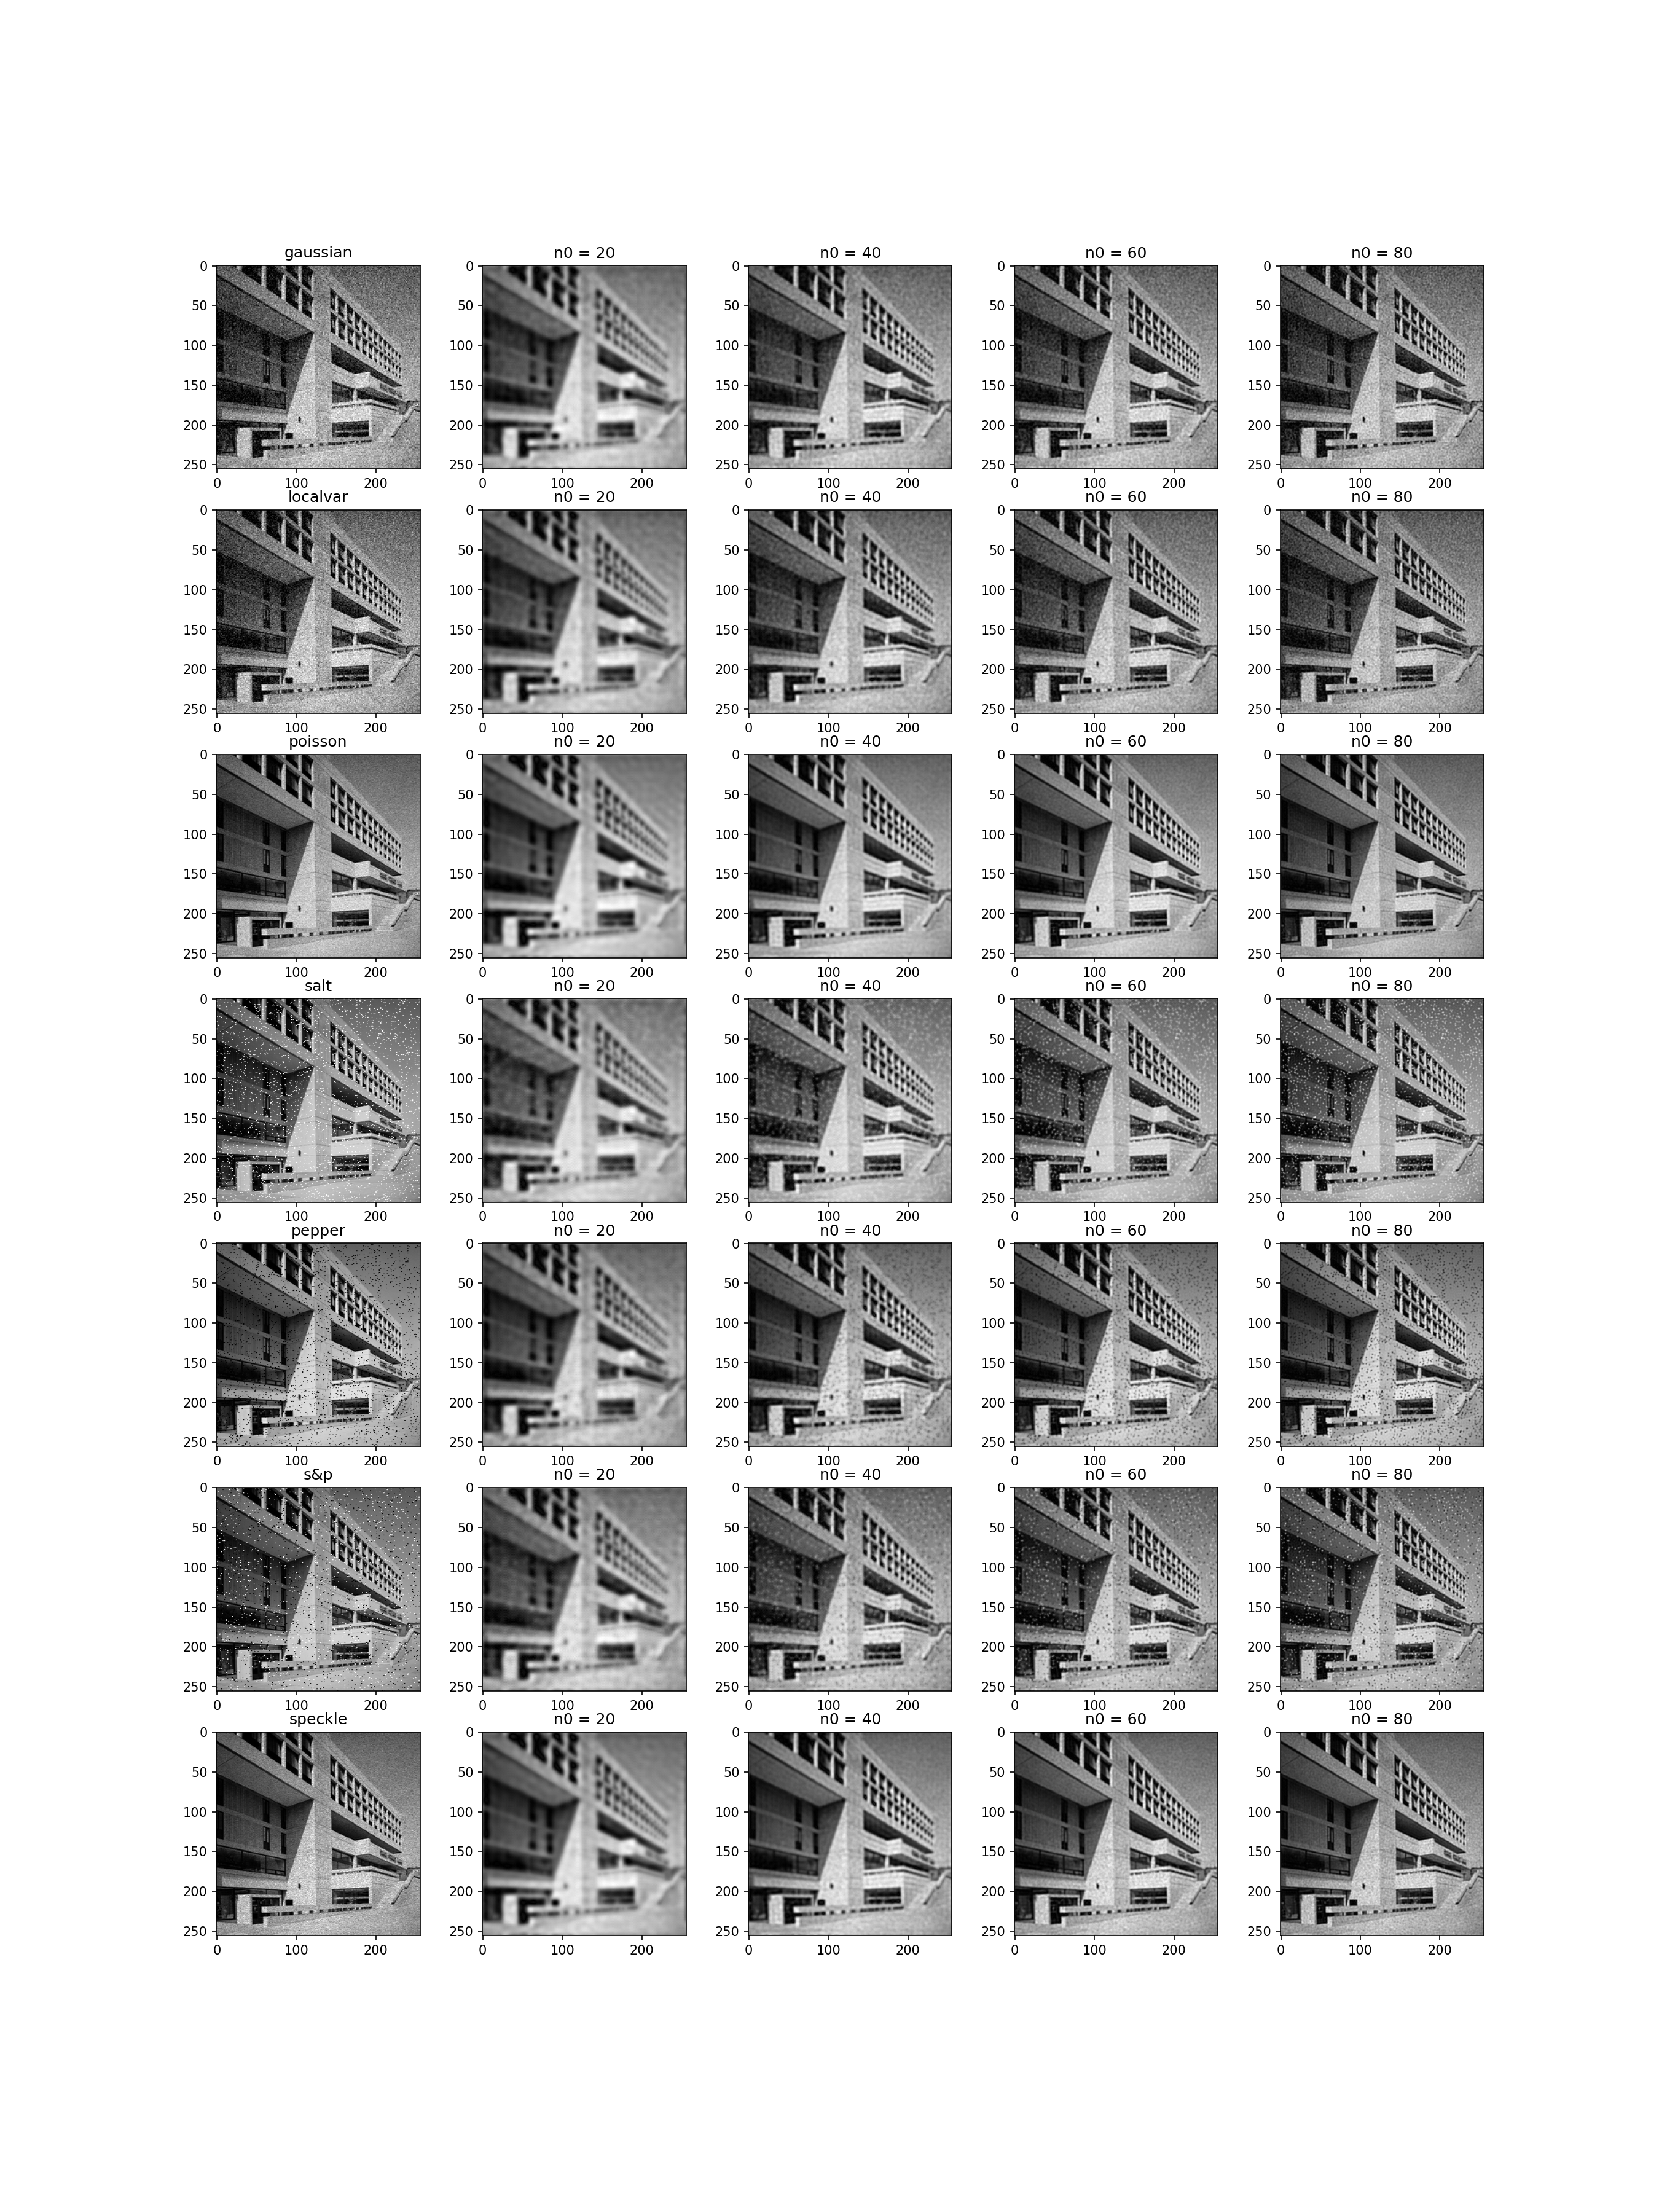
高斯低通滤波器 (GLPF)
$$ H(u,v) = exp\{- [\frac{D(u,v)}{D_0}]^n\} $$
def glpf(img,n0):
    G = np.fft.fft2(img)
    FG = np.fft.fftshift(G)
    x = FG.shape[0]
    y = FG.shape[1]
    H = np.ones((x,y))
    for i in range(1,x):
        for j in range(1,y):
            r = np.sqrt((i-x/2)**2 + (j-y/2)**2)
            H[i,j] = np.exp(-(r/n0)**3)

    con = H * FG
    return abs(np.fft.ifft2(con))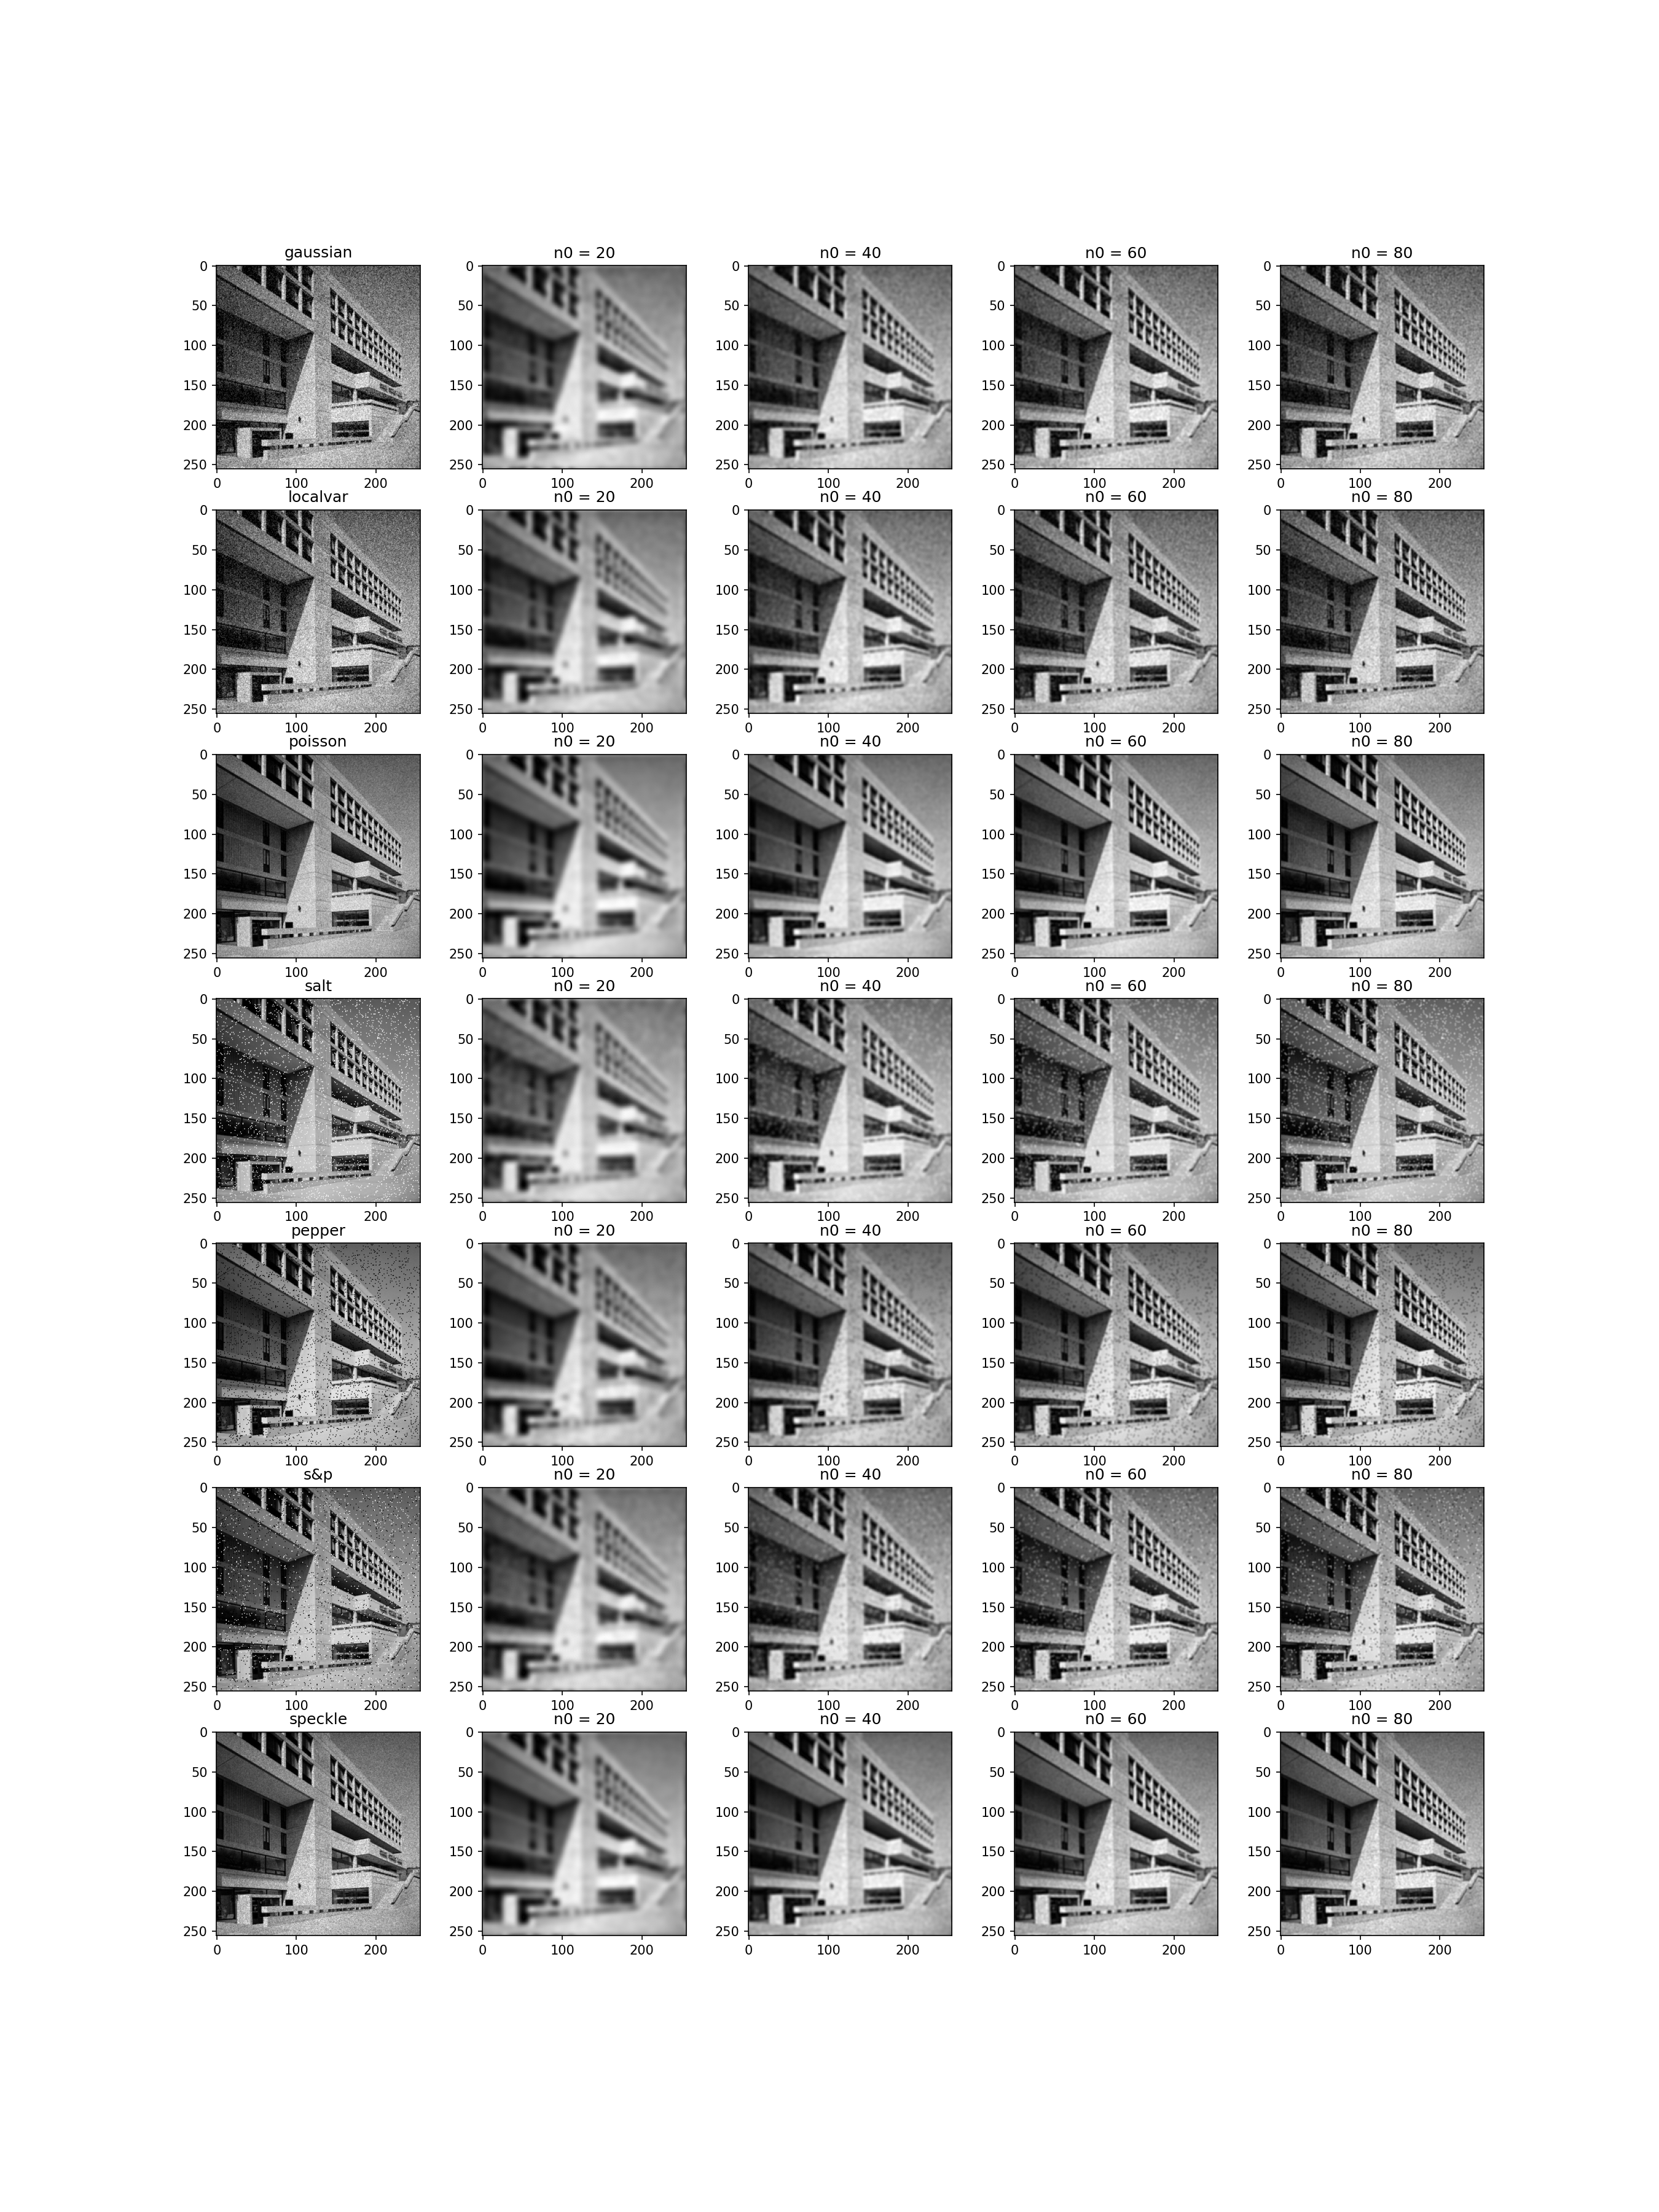
第三题
举例说明顶帽变换在图像阴影校正方面的应用
其实这个问题直接看顶帽变换的Wiki就有答案了
代码实现(选择rice.bmp更容易得出结论)
import numpy as np
import matplotlib.pyplot as plt
import cv2

img = plt.imread('../img/rice.bmp')
kernel = np.ones((100,100),np.uint8)

tophat = cv2.morphologyEx(img,cv2.MORPH_TOPHAT,kernel)
# 顶帽变换
ret, ostu = cv2.threshold(img,0,255,cv2.THRESH_OTSU)
# 对原图做阈值分割
th_ret, th_ostu = cv2.threshold(tophat,0,255,cv2.THRESH_OTSU)
# 对顶帽变换后的图片做阈值分割

plt.figure(figsize=[9,10],dpi=100)
plt.subplot(2,2,1)
plt.title('Origin')
plt.imshow(img,cmap='gray',vmin=0,vmax=255)

plt.subplot(2,2,2)
plt.title('Origin OTSU')
plt.imshow(ostu,cmap='gray',vmin=0,vmax=255)

plt.subplot(2,2,3)
plt.title('Top Hat')
plt.imshow(tophat,cmap='gray',vmin=0,vmax=255)

plt.subplot(2,2,4)
plt.title('Top Hat OTSU')
plt.imshow(th_ostu,cmap='gray',vmin=0,vmax=255)

plt.savefig('output.png',dpi='figure',format='png')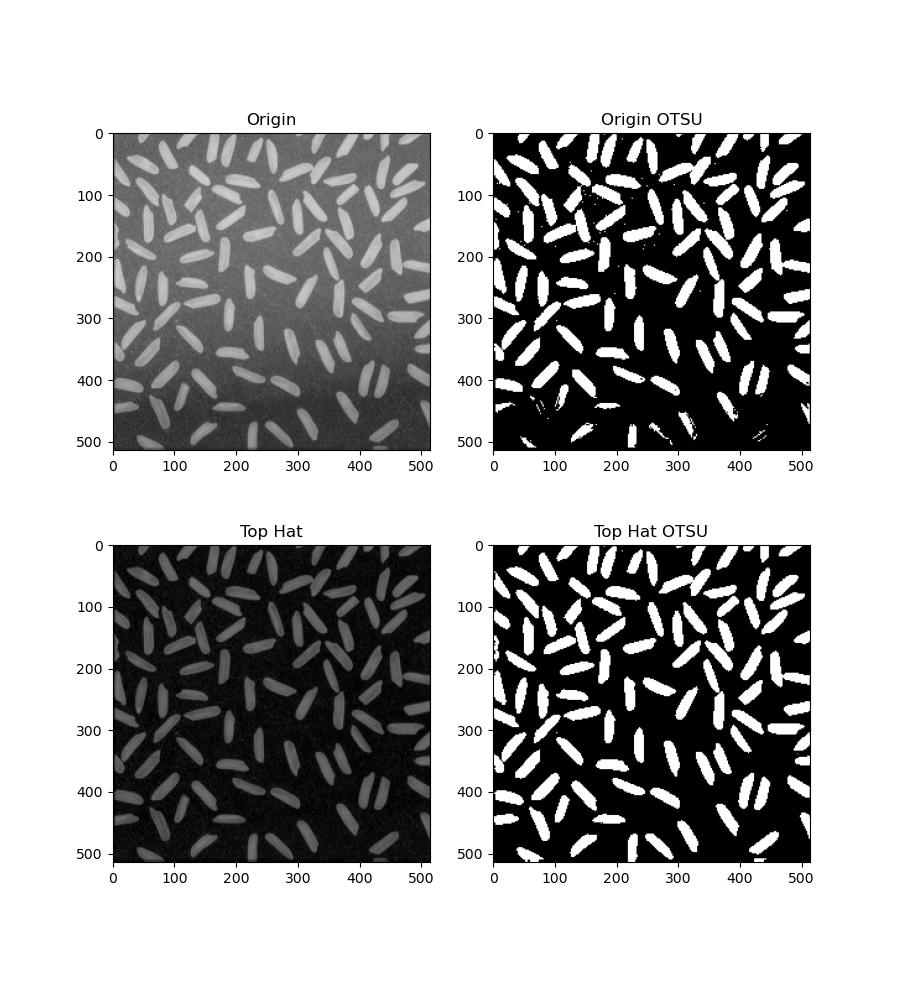
第四题
利用Hough变换来检测图像中的直线,与变换过程相关的系列约束条件(线段的最小长度等)可自行叠加。
这里主要有两个操作,一个是 cv2.Canny()得到图像边缘,一个是 cv2.HoughLines() 检测图像中的直线。
import numpy as np
import matplotlib.pyplot as plt
import cv2

img = cv2.imread('../img/bank.bmp')
gray = cv2.cvtColor(img,cv2.COLOR_BGR2GRAY)

edges = cv2.Canny(gray,100,100,apertureSize=3)
# 检测边缘

def print_lines(index):
    length = index*10 + 50
    lines = cv2.HoughLines(edges,1,np.pi/180,length)
    # 检测直线
    img_copy = img.copy()
    for line in lines:
        for rho,theta in line:
            a = np.cos(theta)
            b = np.sin(theta)
            x0 = a*rho
            y0 = b*rho
            x1 = int(x0 + 1000*(-b))
            y1 = int(y0 + 1000*(a))
            x2 = int(x0 - 1000*(-b))
            y2 = int(y0 - 1000*(a))
            cv2.line(img_copy,(x1,y1),(x2,y2),(0,0,255),1)
            plt.subplot(2,3,index)
            plt.title(f'Min Length {length}')
            plt.imshow(img_copy)
            # 绘制直线

plt.figure(figsize=[12,8],dpi=150)

plt.subplot(2,3,1)
plt.title('Origin')
plt.imshow(img)

for i in range(2,7):
    print_lines(i)
# 用最小长度做约束条件

plt.savefig('output.png',dpi='figure',format='png')
plt.show()
plt.close()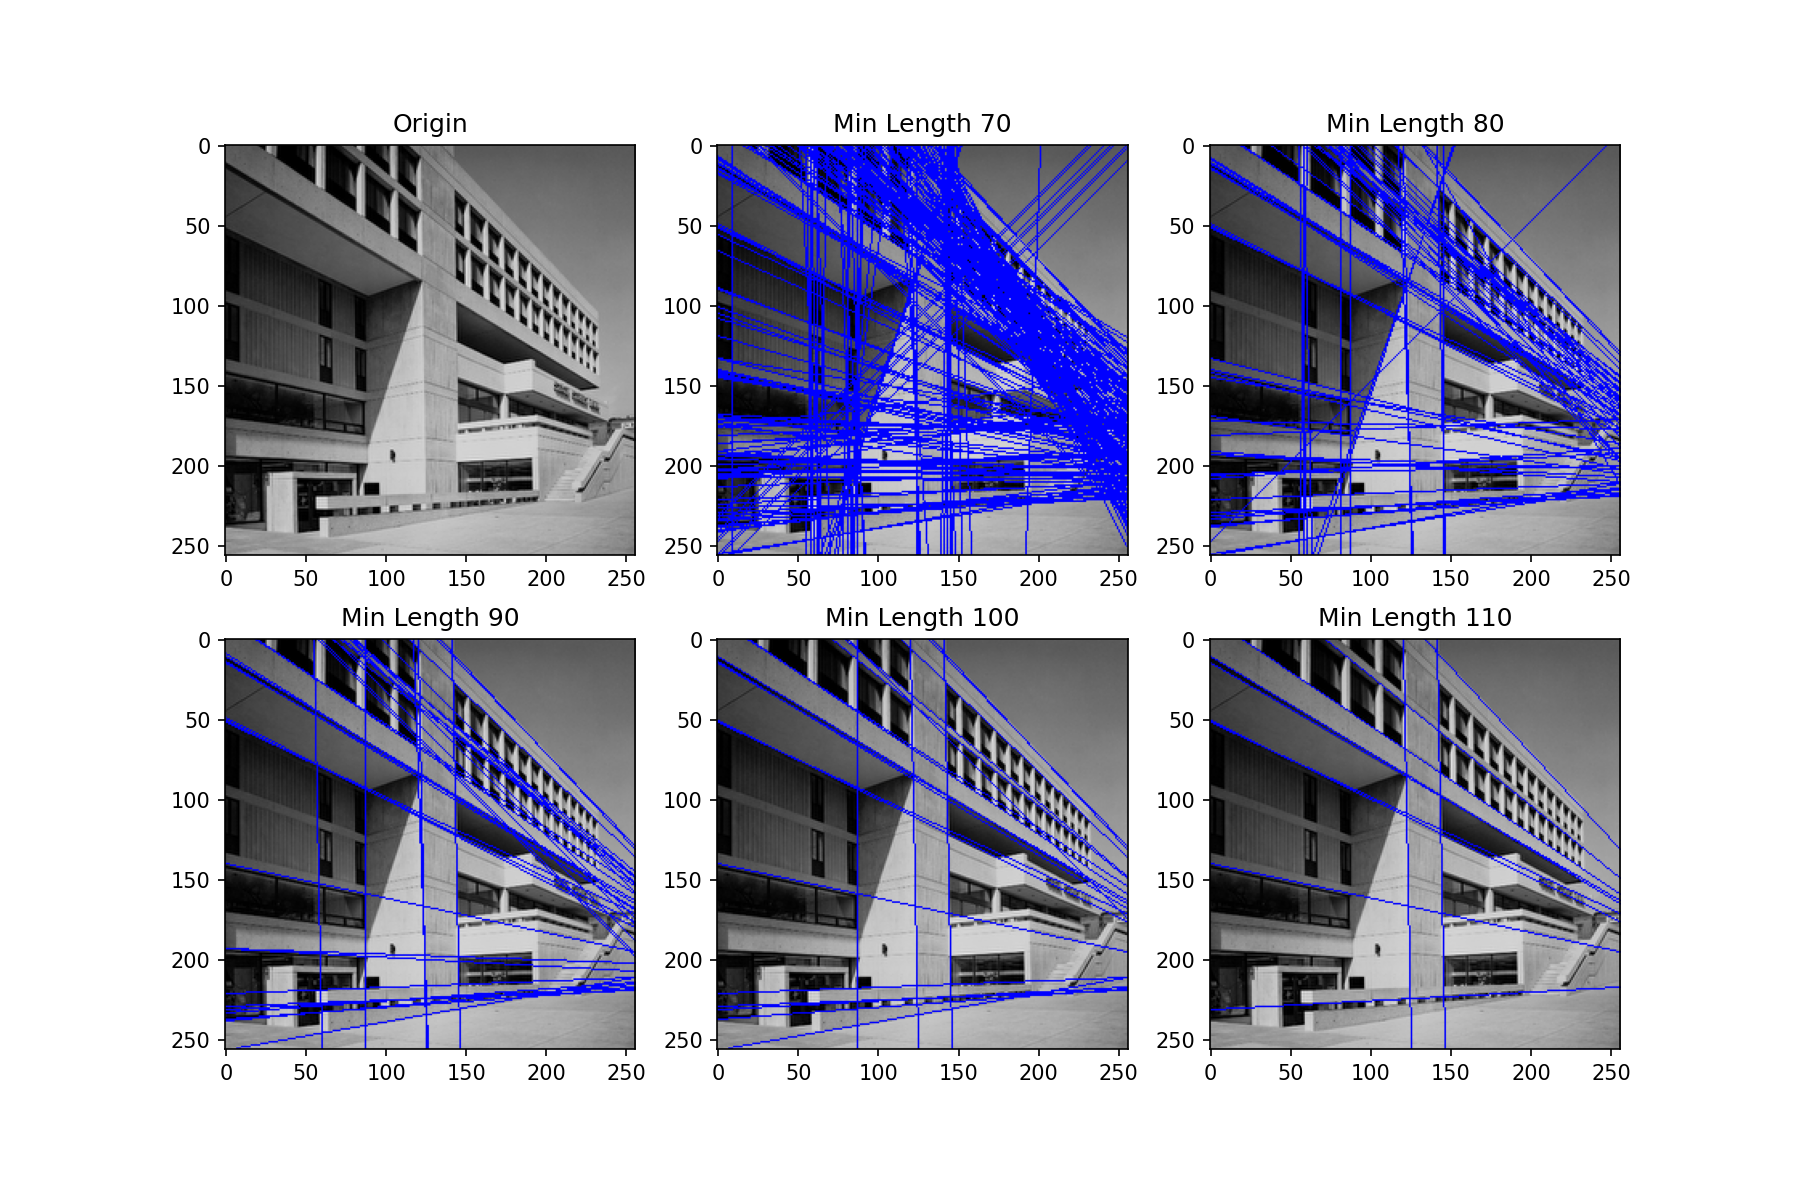
第五题
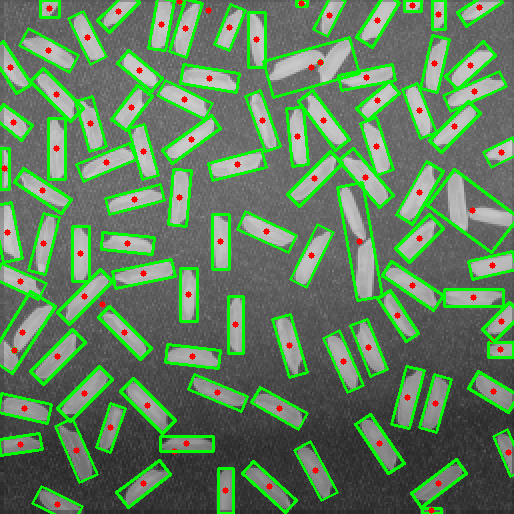
对图像执行阈值分割操作并统计出每一个区域块的属性,然后,将每个区域的中心和外接矩形给标注出来。
这里还是建议用rice.bmp那张图片,因为容易分割。
import matplotlib.pyplot as plt
import numpy as np
import cv2

# 读取图像
img = cv2.imread('../img/rice.bmp')
gray = cv2.cvtColor(img,cv2.COLOR_BGR2GRAY)

# 使用顶帽变换修复阴影
tophat = cv2.morphologyEx(gray,cv2.MORPH_TOPHAT,np.ones((100,100),np.uint8))

# 使用OTSU阈值分割
ret,otsu = cv2.threshold(tophat,50,127,cv2.THRESH_OTSU)

# 寻找区块边缘
contours,hierarchy = cv2.findContours(otsu, cv2.RETR_TREE,cv2.CHAIN_APPROX_SIMPLE)

for contour in contours:
    # 获取区块的外界矩形,以及区域中心
    rect = cv2.minAreaRect(contour)
    box = np.int0(cv2.boxPoints(rect))
    max_x = box[:,0].max()
    min_x = box[:,0].min()
    max_y = box[:,1].max()
    min_y = box[:,1].min()
    # 绘制外接矩形和中心点
    center = (int((max_x + min_x)/2), int((max_y + min_y)/2))
    img = cv2.drawContours(img,[box],-1,(0,255,0),2)
    img = cv2.circle(img,center,3,(255,0,0),-1)
cv2.imwrite('./output.png',cv2.cvtColor(img,cv2.COLOR_BGR2RGB))
plt.imshow(img)
plt.show()
plt.close()
(这里有一点问题,因为我直接调用库了,不太清楚需要标的属性是啥)
第六题
设计一个简易的Matlab GUI界面程序,要求其具有如下的功能:
- 打开与保存图像时均打开文件名设置对话框;
- 当下拉菜单中的条目被选中时,列表框之中实时的记录下当前的选择;
- 通过编辑框来实现相关参数的交互式输入;
- 将输入图像及处理后结果显示在相应的坐标轴之上;
- 含有工具栏和菜单栏,当选择其下的组件成分时,要有相应的图像处理行为发生;
- 将figure窗口的“Name”属性修改为自己的姓名和学号;
- 将所设计的GUI程序编译为“.exe”形式的可执行文件
这题我就不放代码了,大概说一下方法吧。我使用PyQt来做的,实现的功能是第四题的那个直线检测,用滑动条以更改最小长度。
先用QtDesigner把.ui设置出来,然后对着PyQt的文档查每个组件的使用方式,很快就可以完成了(记得做异常处理)。
最后来说下我对这个课的感受吧。这课感觉不应该给大一的学生开,有点太硬核了,如果你是想认真学的话建议等到大二再选,不然可能就跟我一样成为调包侠,对其中的原理并没有多少认知。当然水学分就是另一回事了x。
Update
2020.07.29 老师给分很大方,i了i了
引用
- https://gist.github.com/Prasad9/28f6a2df8e8d463c6ddd040f4f6a028a#gistcomment-2933012
- https://scikit-image.org/docs/stable/api/skimage.util.html#skimage.util.random_noise
- Image Processing and Acquisition using Python - Ravishankar Chityala, Sridevi Pudipeddi
- https://docs.opencv.org/master/d7/d4d/tutorial_py_thresholding.html
- https://opencv-python-tutroals.readthedocs.io/en/latest/py_tutorials/py_imgproc/py_canny/py_canny.html
- https://opencv-python-tutroals.readthedocs.io/en/latest/py_tutorials/py_imgproc/py_houghlines/py_houghlines.html
- https://cloud.tencent.com/developer/article/1052878


牛哇牛哇
By 轩轩子 at October 19th, 2021 at 07:15 pm.